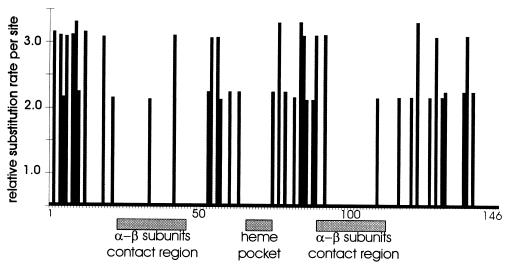
Figure 3.
Differences among sites in the rate of amino acid substitutions were examined generating a variability profile along the β-globin sequence. First, we used an MP approach to estimation of the parameter a of the γ distribution (36) with four categories of rate, based on the obtained topology (19). Second, substitution rates per site were estimated with a discrete γ model, as implemented in paml. Evolutionary rates were scaled such that the mean of rates across sites was one. On the horizontal axis are reported the amino acid residues of the major notothenioid Hb (1–146). On the vertical axis are indicated the “relative” values of substitution rate at each site. Gray boxes, protein regions that are essential for proper Hb function.

