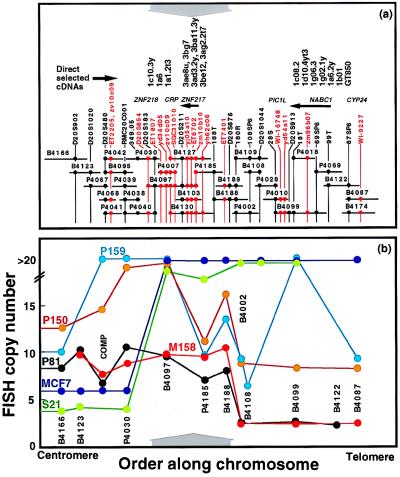
Figure 1.
(a) Physical map of 20q13.2 between D20S902 and WI-9227. Clones that make up the map are indicated as horizontal lines. The lengths of the lines are proportional to the sizes of the clones. The last five digits of the RMC identifiers listed in Table 1 identify clones. Mapped STSs and ESTs in this region are shown as vertical black and red lines, respectively. •, Clones that tested positive for STS or EST content by PCR. The approximate genome locations of five genes and a pseudogene are shown above the map. Arrowheads indicate transcriptional polarity where known. The approximate locations of 17 of 30 directly selected cDNA fragments are shown at the top. (b) FISH analysis of DNA sequence copy number in five informative breast tumors and one breast cancer cell line. Probes used in this study are indicated. The probe labeled COMP comprised clones P4030, P4040, P4038, P4039, P4041, and P4042. The vertical axis shows the number of hybridization signals produced by FISH with each probe. The number of signals is truncated at 20 because hybridization signal enumeration was difficult above this level. The x axis scales are the same for a and b. The results of six FISH studies are color coded by sample. Solid lines connect the measurements made for each sample. A ≈260-kb region of common maximal amplification is indicated by gray arrows above (a) and below (b).

