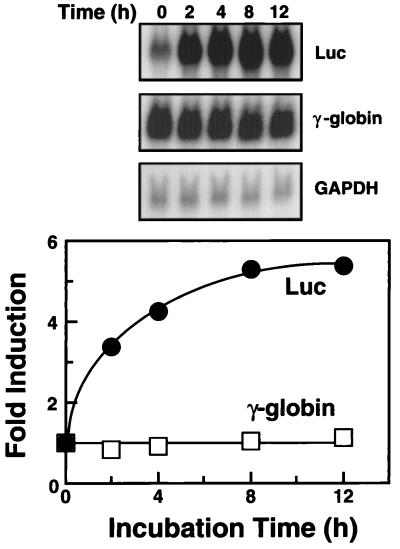
Figure 2.
TPA induction of luciferase mRNA. Total RNA isolated from the stably transfected clonal cell line HS2(2.2)-1, treated with 5 nM TPA for the indicated time, was examined by Northern blot analysis. Shown are the results of successive hybridization of the same filter to the luciferase, γ-globin, and glyceraldehyde-3-phosphate dehydrogenase (GAPDH) gene probes. Signal intensities were quantified by using a PhosphorImager, and luciferase and γ-globin mRNA levels, normalized to those of GAPDH, were plotted.

