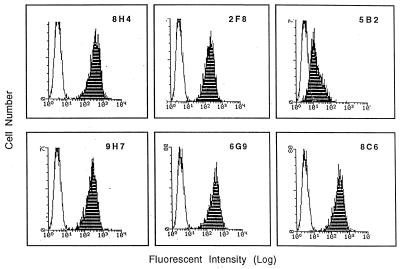
Figure 4.
Expression of PrPc on the surface of transfected human neuroblastoma cell line analyzed by FACScan. Clear areas represent staining of PrPc-negative parental M17 cells. Shaded areas represent staining of PrP-positive transfectants. mAb 5B2 stains less intensely than other mAbs probably because it does not react with truncated PrPc forms.

