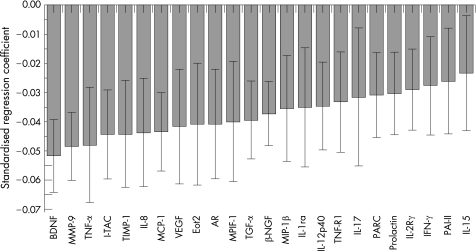
Figure 1 Correlation of the selected biomarker panel with forced expiratory volume in 1 s (FEV1) in patients with COPD. The size of the bar in the graph indicates the magnitude of the regression coefficients and the 95% confidence interval is also indicated for each bar. If the confidence interval includes zero, the associated biomarker is “not significant”. The overall regression model was significant by a permutation test (p<0.01). The standardised coefficients for this and for figs 2, 3 and 4 are for scaled and centred markers and scaled response. These coefficients can be used to interpret the influence of the markers on the clinical response. The standardised regression coefficient for each marker measures the effect of the marker on the clinical response adjusted for all other markers in the regression (partial correlation). The coefficients can also be compared across the clinical responses since they are scaled. Definitions of the biomarkers are given in the footnote to table 4.

An official website of the United States government
Here's how you know
Official websites use .gov
A
.gov website belongs to an official
government organization in the United States.
Secure .gov websites use HTTPS
A lock (
) or https:// means you've safely
connected to the .gov website. Share sensitive
information only on official, secure websites.
