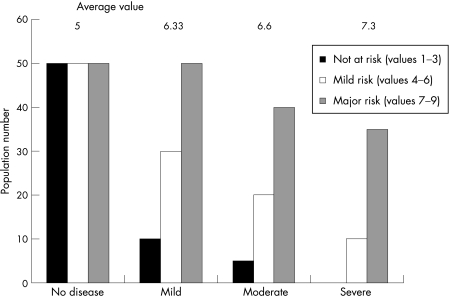
Figure 2 Diagrammatic representation of the relationship between the average biomarker concentration and severity of lung disease. The data are related to three populations of individuals at no risk with low levels of the biomarker, those at intermediate risk with intermediate levels and those at high risk with high levels. In cross‐sectional studies, as the disease severity increases the proportion of patients in the high‐risk group also increases, leading to a rise in the average biomarker level for the group.

An official website of the United States government
Here's how you know
Official websites use .gov
A
.gov website belongs to an official
government organization in the United States.
Secure .gov websites use HTTPS
A lock (
) or https:// means you've safely
connected to the .gov website. Share sensitive
information only on official, secure websites.
