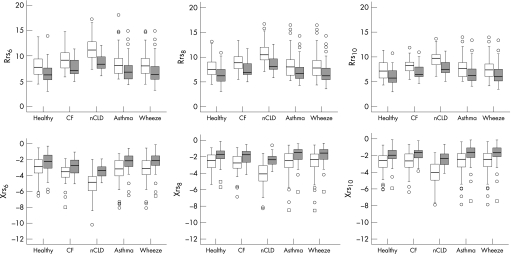
Figure 1 Pre‐ and post‐bronchodilator responses in all groups measured by resistance (Rrs) and reactance (Xrs) at 6, 8 and 10 Hz. Open circles and squares indicate outliers and extreme values, respectively. Post‐bronchodilator responses (shaded boxplots) were significantly different from pre‐bronchodilator responses (clear boxplots) for all parameters in all groups (p<0.05, Wilcoxon signed rank test). CF, cystic fibrosis; nCLD, neonatal chronic lung disease.

An official website of the United States government
Here's how you know
Official websites use .gov
A
.gov website belongs to an official
government organization in the United States.
Secure .gov websites use HTTPS
A lock (
) or https:// means you've safely
connected to the .gov website. Share sensitive
information only on official, secure websites.
