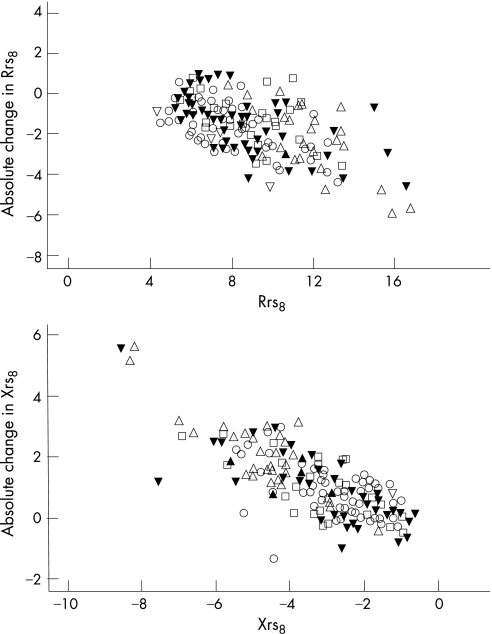
Figure 2 Absolute bronchodilator response plotted against baseline for resistance (Rrs) and reactance (Xrs) at 8 Hz. Different symbols indicate different groups (circles, healthy; squares, cystic fibrosis; up triangles, neonatal chronic lung disease; down triangles (solid), asthma; down triangles (open), wheeze only.

An official website of the United States government
Here's how you know
Official websites use .gov
A
.gov website belongs to an official
government organization in the United States.
Secure .gov websites use HTTPS
A lock (
) or https:// means you've safely
connected to the .gov website. Share sensitive
information only on official, secure websites.
