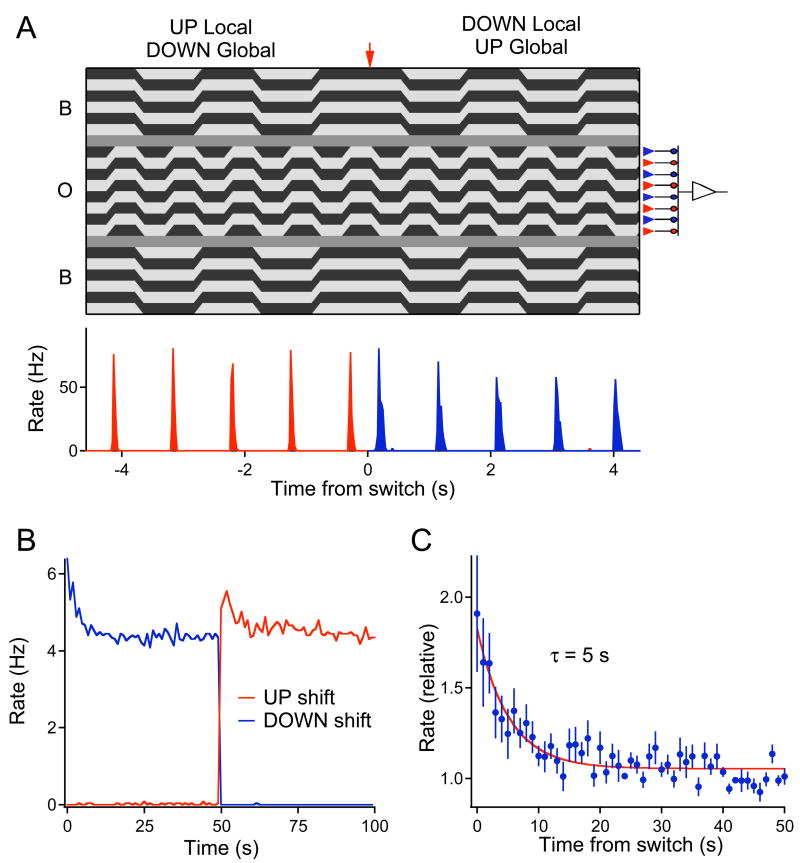
Figure 7. Differential motion adaptation happens before spatial summation of the center.
(A) Top: Stimulus designed to probe adaptation at the bipolar cell terminals. The object grating shifted back and forth by one bar width (67 μm) at 2 Hz. The background grating shifted at 1 Hz, in synchrony with the downward shifts of the object grating; 50 s later, the background switched phase to synchronize with upward shifts of the object. The transition is marked by the arrow. A simplified circuit diagram (right) illustrates how the up- and down-shifts of the object grating drive two distinct populations of bipolar cells, thereby separating their inputs to the ganglion cell in time. Bottom: Firing rate of an OMS cell in response to the above stimulus. Average over 30 trials. (B) Response of an OMS ganglion cell to the stimulus in (A) averaged over 30 trials. Each data point reflects the average firing rate during one shift of the object grating. In the interval 0–50 s the background shifts coincided with upward object shifts, in 50–100 s with downward object shifts. (C) Responses averaged over 12 OMS cells and both phases of the stimulus.

