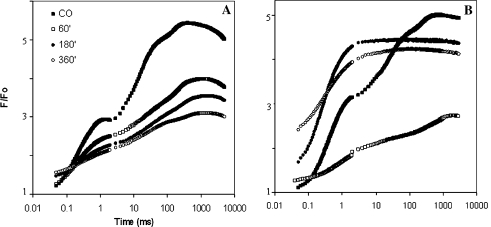
Fig. 3.
Fluorescence induction curves after various treatments of leaves. (A) Fluorescence transients after 0, 60, 180, and 360 min irradiation with UV-B light at 150 μmol m−2 s−1. ( PAR is zero). (B) ■, After infiltration with 0.5% ethanol (CO is control), no UV-B; ●, after infiltration with 10−5 M DCMU in 0.5% ethanol, no UV-B; □, after infiltration with 0.5% ethanol and 6 h irradiation with 150 μmol m−2 s−1 UV-B light; ◯, after infiltration with 10−5 M DCMU in 0.5% ethanol and 6 h irradiation with UV-B. Each curve is the average of three measurements

