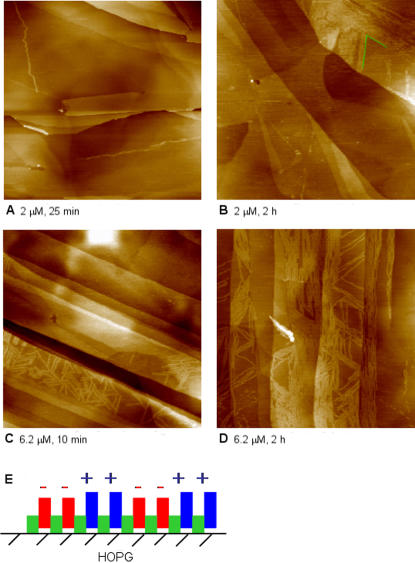
Figure 4. AFM images of EAK 16-II-modified HOPG surface at different concentrations and time periods: (a) 2 µM, 25 min; (b) 2 µM, 2 h; (c) 6.2 µM, 10 min; (d) 6.2 µM, 2 h after different incubation periods.
(e) schematic diagram of EAK16-II in a β-strand conformation on HOPG. Each AFM image corresponds to a scan area of 1000 nm×1000 nm.

