
Figure 5.
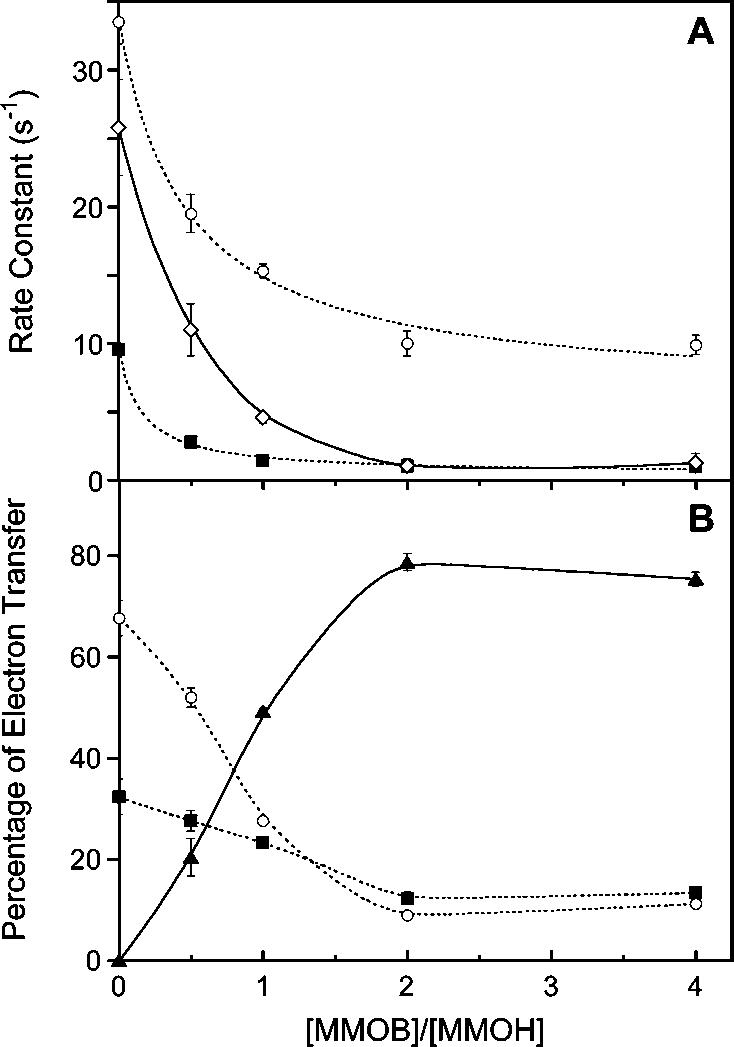
Effect of MMOB on electron transfer from reduced MMOR-Fd(1-107) to oxidized MMOH at 4 °C. (A) Variation of rate constants with MMOB concentration: k1 (circles), k2 (squares), and weighted average (diamonds). (B) Partitioning of electrons through the k1 (circles), k2 (squares), and k3 (triangles) reaction phases as a function of MMOB concentration. The lines shown here are for illustrative purposes only and do not represent fits to a model.