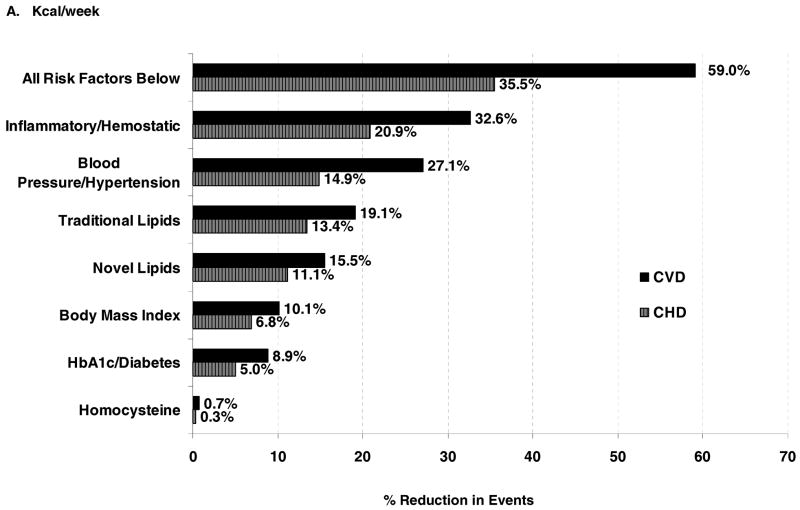
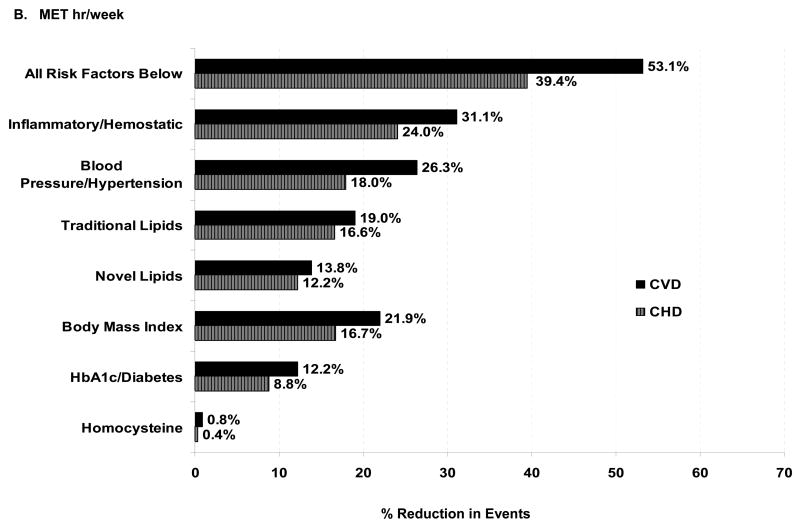
Figure.
Percentage reduction in CVD events associated with physical activity that is explained by risk factors. The proportion of the risk reduction for ≥1500 kcal/wk of physical activity (compared with the reference group of <200 kcal/wk, Panel A), and for >20.5 MET hrs/wk (compared with the reference group of <2.8 MET hrs/wk, Panel B), that is explained by each set of potential risk factors, calculated as (HRbasic model – HRadjusted model)/(HRbasic model -1) X 100%.24 These proportions were calculated from HRs expressed up to 5 decimal points for greater accuracy, and thus may differ slightly from the data shown in Table 3.


