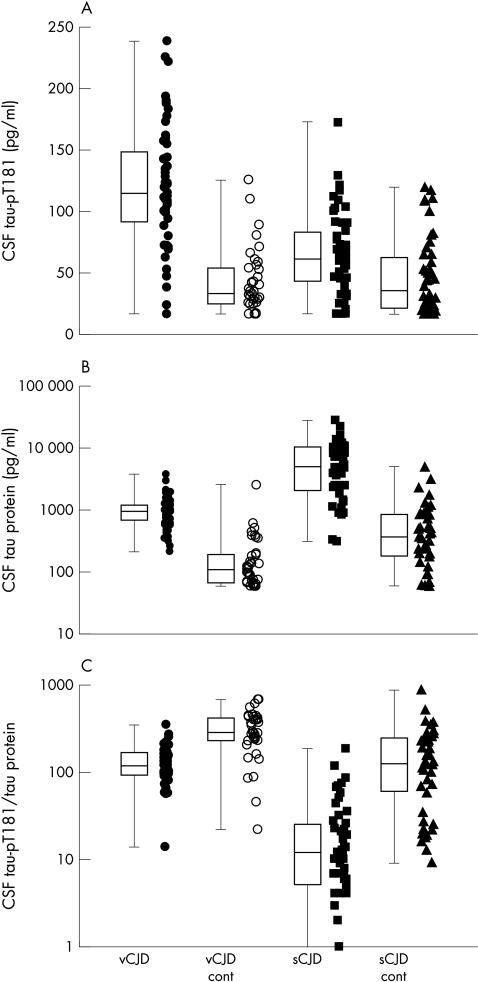
Figure 1 Combined scatter and box plots of CSF tau‐pT181 concentrations, CSF tau protein concentrations, and CSF tau‐pT181/tau protein ratio×1000. Variant CJD (vCJD) cases are represented by filled circles, vCJD controls by empty circles, sporadic sCJD cases (sCJD) by filled squares, and sCJD controls by filled triangles. The scatterplots represent the individual values from which the boxes are derived.

An official website of the United States government
Here's how you know
Official websites use .gov
A
.gov website belongs to an official
government organization in the United States.
Secure .gov websites use HTTPS
A lock (
) or https:// means you've safely
connected to the .gov website. Share sensitive
information only on official, secure websites.
