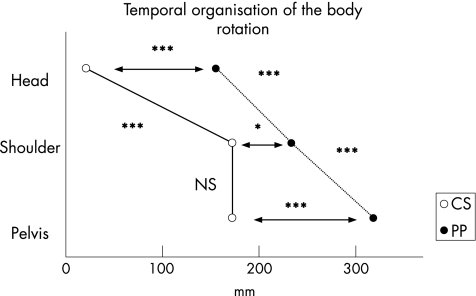
Figure 6 Representation of the temporal organisation of the rotation for patients with Parkinson's disease and controls: comparison between groups and between levels (head, shoulders and pelvis). Horizontal arrows: comparison between groups for a given level. Comparison between levels: on the left and on the right the line joining the onset of segment latencies (left: CS and right: PP). NS, non‐significant; *p<0.05 and ***p<0.001.

An official website of the United States government
Here's how you know
Official websites use .gov
A
.gov website belongs to an official
government organization in the United States.
Secure .gov websites use HTTPS
A lock (
) or https:// means you've safely
connected to the .gov website. Share sensitive
information only on official, secure websites.
