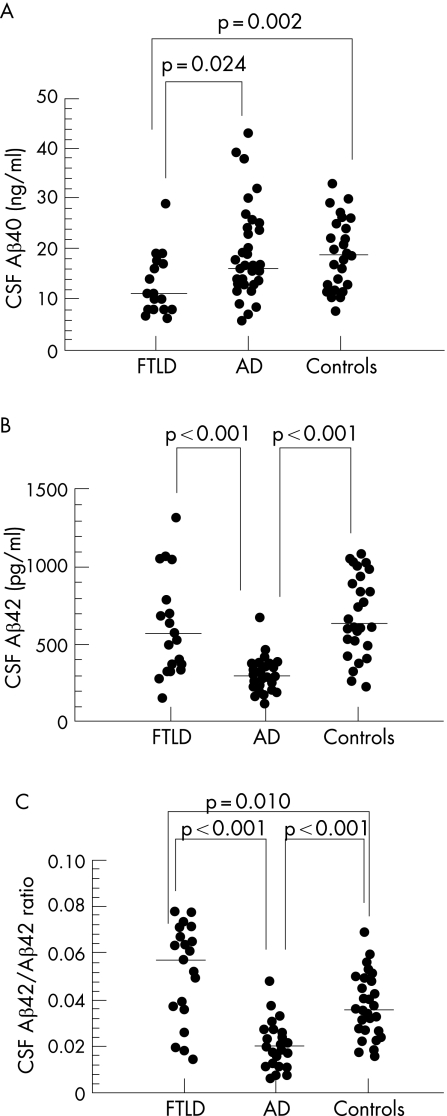
Figure 1 (A–C) Scatterplots of individual levels of CSF amyloid beta 1–40 (Aβ40) (A), amyloid beta 1–42 (Aβ42) (B) and the Aβ42/Aβ40 ratio in patients with frontotemporal lobar degeneration (FTLD) and Alzheimer's disease (AD) and in controls. Significant differences are indicated. Horizontal lines represent median values.

An official website of the United States government
Here's how you know
Official websites use .gov
A
.gov website belongs to an official
government organization in the United States.
Secure .gov websites use HTTPS
A lock (
) or https:// means you've safely
connected to the .gov website. Share sensitive
information only on official, secure websites.
