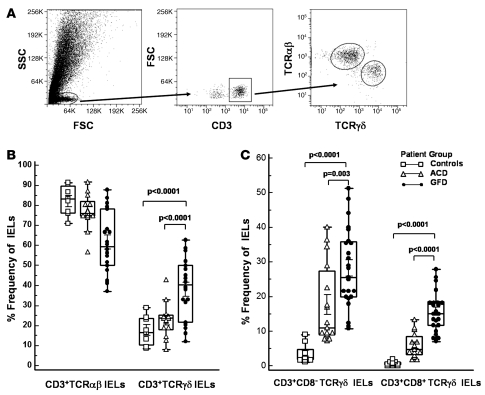
Figure 1. Frequency of TCRγδ subsets in IELs from CD patients.
(A) Flow cytometry dot plots showing gating strategy for CD3+TCRαβ+ IELs and CD3+TCRγδ+ IELs. (B and C) Box-and-whisker plots representing frequencies, as assessed by flow cytometry, of: CD3+TCRαβ+ IELs and CD3+TCRγδ+ IELs in jejunal biopsy samples from ACD patients (n = 15), GFD patients (n = 23), and controls (n = 10) (B); CD3+CD8+TCRγδ+ IELs and CD3+CD8–TCRγδ IELs in jejunal biopsies from ACD patients, GFD patients, and controls (C) (P values calculated using Mann-Whitney U test).

