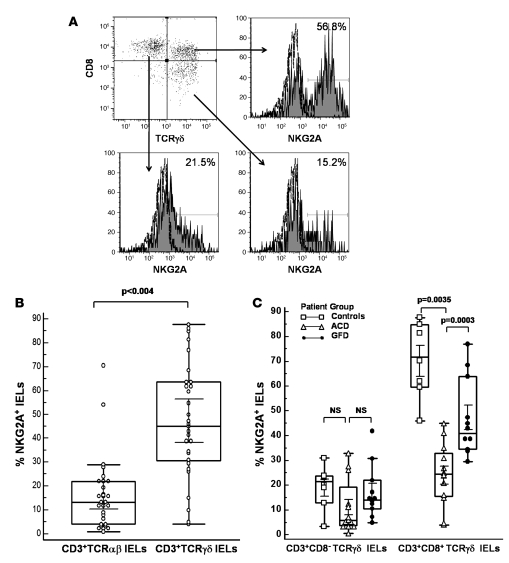
Figure 3. Higher percentage of CD3+CD8+TCRγδ IELs express NKG2A in patients on GFD.
(A) Representative flow cytometry histograms showing percentage of CD3-gated CD8+TCRγδ–, CD8+TCRγδ+, and CD8–TCRγδ+ IELs (sorted from the jejunal biopsies of a GFD patient) expressing surface NKG2A. (B) Box-and-whisker plots comparing percentage of CD3+TCRαβ+NKG2A+ IELs with percentage of CD3+TCRγδ+NKG2A+ IELs. (C) Box and Whisker plots comparing frequencies of CD3+CD8+TCRγδ+ IELs and CD3+CD8–TCRγδ+ IELs expressing NKG2A, from ACD patients (n = 15), GFD patients (n = 23), and controls (n = 10) (P values determined by Mann-Whitney U test).

