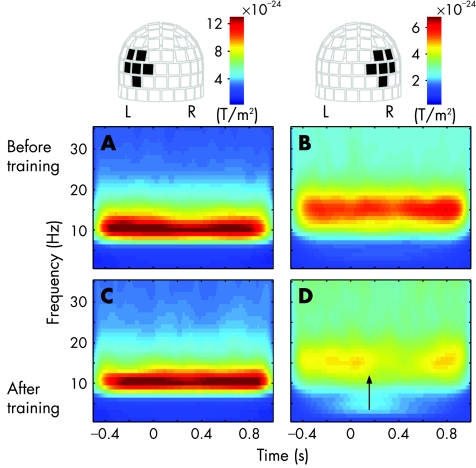
Figure 2 Averaged time–frequency representations of the oscillatory activity for stimulation of the blind hemifield before and after training. On the top, the helmet‐shaped measurement array is viewed from the back, and the black rectangles indicate the averaged channels. Change in the head position between the two measurements is negligible, enabling direct comparison of the datasets. The upper panels show the mean power of the left (A) and right (B) hemisphere before training and the lower panels (C,D) after training. Arrow at 150 ms indicates the onset of suppression. L, left hemisphere; R, right hemisphere.

An official website of the United States government
Here's how you know
Official websites use .gov
A
.gov website belongs to an official
government organization in the United States.
Secure .gov websites use HTTPS
A lock (
) or https:// means you've safely
connected to the .gov website. Share sensitive
information only on official, secure websites.
