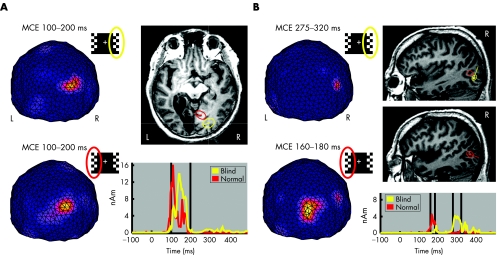
Figure 3 Minimum current estimates (MCEs), mean locations of sources, and time courses of the sources after training. (A) MCEs between 100 and 200 ms viewed from the back (L, left hemisphere; R, right hemisphere). Source explaining the response evoked by stimulation of the blind hemifield is shown in yellow and that by stimulation of the normal hemifield in red. The radii of the reported regions of interest (ROIs; ellipsoids on the magnetic resonance images (MRIs), the line indicating the current direction) show the distances at which the weighting functions are reduced to 60%. Vertical lines indicate the time range 100–200 ms. (B) MCEs between 275 and 320 ms after stimulation of the blind hemifield and between 160 and 180 ms after stimulation of the normal hemifield, and the locations of sources (R, right sagittal slice) and time courses of sources. nAm, nanoamperemeter.

An official website of the United States government
Here's how you know
Official websites use .gov
A
.gov website belongs to an official
government organization in the United States.
Secure .gov websites use HTTPS
A lock (
) or https:// means you've safely
connected to the .gov website. Share sensitive
information only on official, secure websites.
