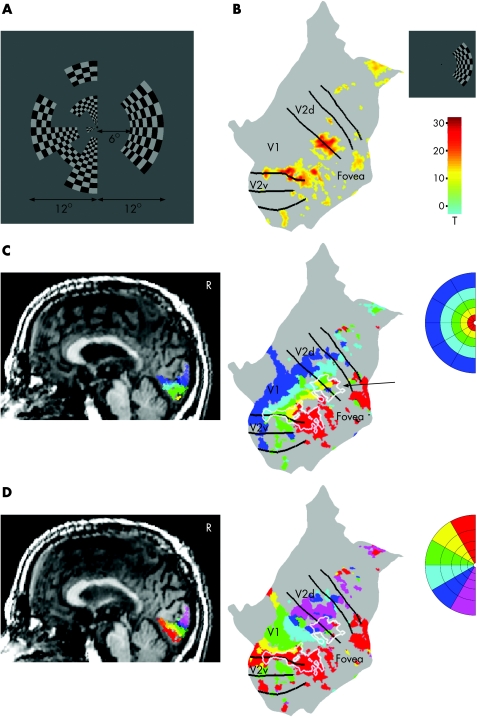
Figure 6 Fixation control measurement with a 31‐region multifocal magnetic resonance image (fMRI). (A) An example of a multifocal stimulus frame. The patient fixates on a point in the middle of the display. (B) Response to multifocal stimulation of the blind (right) hemifield assigned to the cortical surface of the patient's intact (right) occipital cortex. The black lines indicate the borders between retinotopic areas. (C) Responses to multifocal stimulation of the normal (left) hemifield shown on his structural magnetic resonance image (activations thresholded at pFWE<0.05, R; right sagittal slice) and assigned to the cortical surface of the intact occipital cortex (thresholded at T>10). Colours of the activated clusters code the eccentricity of the visual field. In the unfolded view, the white outline indicates the location of the response to multifocal stimulation of the blind hemifield. (D) Same data as in (C), but colours code the polar angle of the normal hemifield, enabling the comparison between retinotopic organisations mapped with the multifocal method and borders between retinotopic areas mapped with the phase‐encoded approach.

An official website of the United States government
Here's how you know
Official websites use .gov
A
.gov website belongs to an official
government organization in the United States.
Secure .gov websites use HTTPS
A lock (
) or https:// means you've safely
connected to the .gov website. Share sensitive
information only on official, secure websites.
