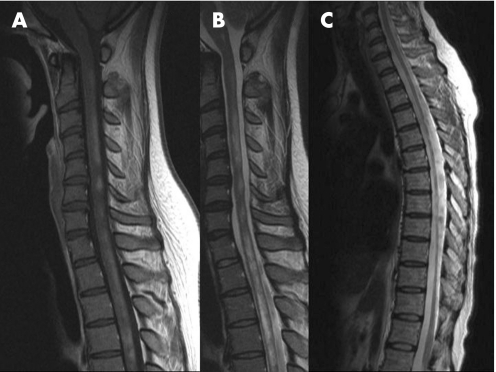
Figure 1 MRI findings of patients with long spinal cord lesions–multiple sclerosis (LCL‐MS). The patient shows discontinuous enhanced lesions from C1 to Th5 (A) and discontinuous T2 high intensity lesions in the cervical segment and T2 high intensity lesions from Th1 to Th5 (long T2 lesion) (B). Another patient shows segmental spinal cord atrophy from C7 to Th11 (C).

An official website of the United States government
Here's how you know
Official websites use .gov
A
.gov website belongs to an official
government organization in the United States.
Secure .gov websites use HTTPS
A lock (
) or https:// means you've safely
connected to the .gov website. Share sensitive
information only on official, secure websites.
