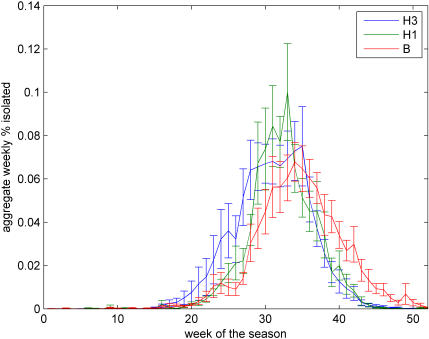
Figure 2. Mean aggregate incidence curves by type and subtype for the Northern Hemisphere.
Weekly incidence values for each type and subtype were summed for the Northern Hemisphere for each of the nine study seasons and normalized as a percentage of the total number of isolates of that particular type or subtype recorded over the nine year study period. The average value for each week (±SE) were plotted versus time for each type and subtype. The profiles clearly show that influenza B lags the other two subtypes (see text).

