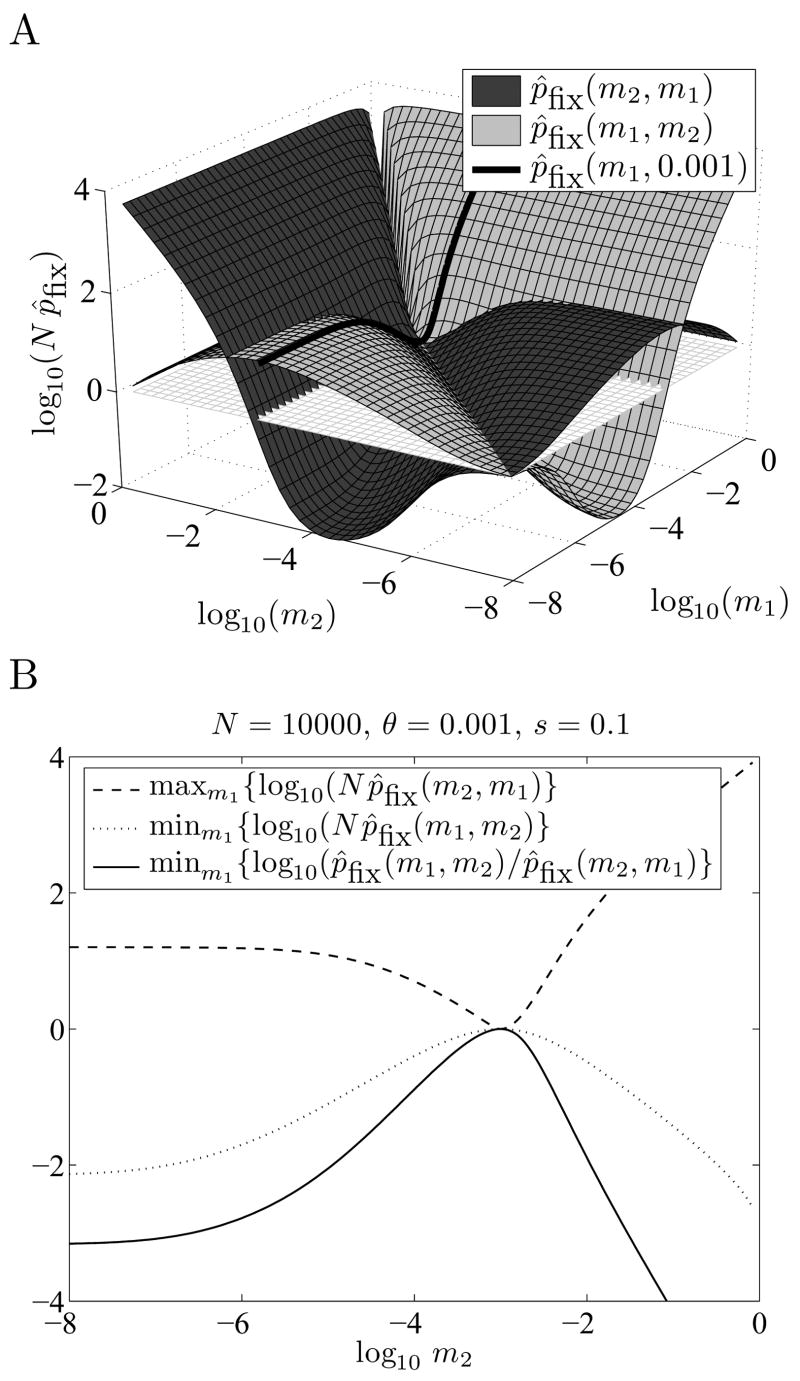
Figure 3.
The optimal switching probability is unique. Part A shows the surfaces of estimated fixation probabilities p̂fix(m1,m2) and p̂fix(m2, m1). Here m̂opt ≈ θ = 0.001 --- note that p̂fix (m1,0.001) ≥ p̂fix (0.001,m1) for all m1 in the interval [0, 1]. Part B shows that there is a unique optimal value: m̂opt ≈ = 0.001 is the only m2 for which p̂fix(m1, m2) ≥ p̂fix(m2, m1) for all m1 (solid line). It is also the only m2 for which p̂fix(m1, m2) ≥ 1/N for all m1 (dotted line), and the only m2 for which p̂fix (m2, m1) ≤ 1/ N for all m1 (dashed line).

