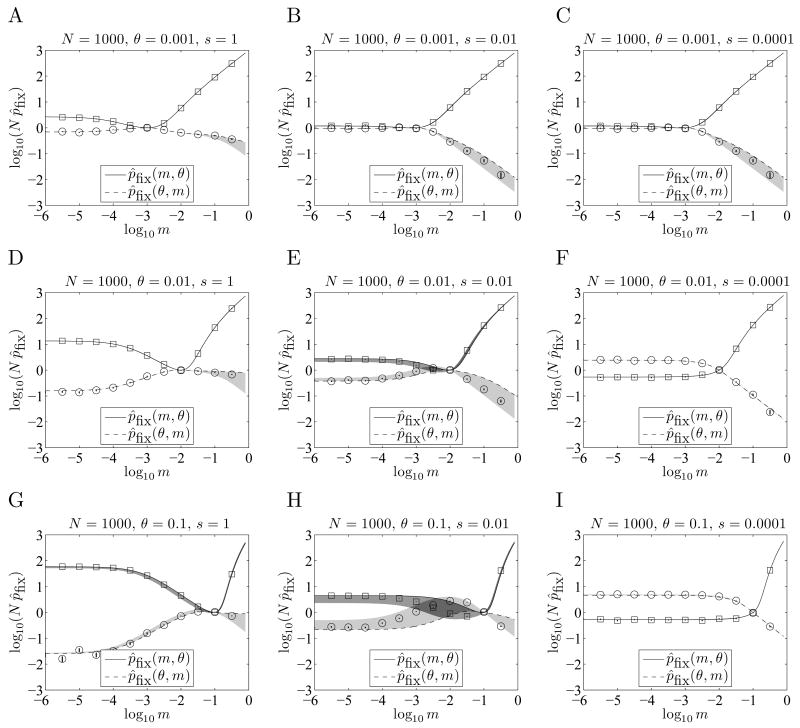
Figure 4.
Accuracy of fixation probability formula. Here we compare the approximate fixation probabilities computed with Equation 1 to Monte Carlo (MC) simulations for N = 1000. In parts A - I, θ varies by row, and s by column. The MC estimates for pfix (m, θ) and pfix (θ, m) are indicated by squares and circles respectively, and the vertical bars through these symbols indicate the standard error based on 106 trials. Equation 1 sometimes becomes inaccurate when θ and m are large, particularly for intermediate values of sN ≈ 10, for which selection is important but fairly slow. This is most noticeable in part H. Note that m̂opt ≈ θ for s = 1, but switching probabilities smaller than θ are favored for s = 0.0001. The gray shaded areas indicate the regions between p̂fix from Equation 1 and the heuristic bound for pfix described in Appendix C. The heuristic bound for pfix (m1, m2) is typically a lower-bound when m1 < m2 and an upper-bound when m2 < m1. (The shaded areas are often too narrow to be seen.)

