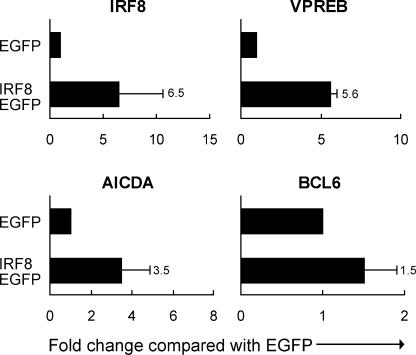
Figure 3.
Transcript levels measured by qPCR for genes in total tonsillar B cells transfected with EGFP-tagged WT IRF8 or EGFP only and sorted 18 h later for EGFP+ and EGFP cells. Data are from independent studies (three for VPREB and nine for IRF8, AICDA, and BCL6). Numbers indicate the fold change represented by the closed bars. Values indicate SD.

