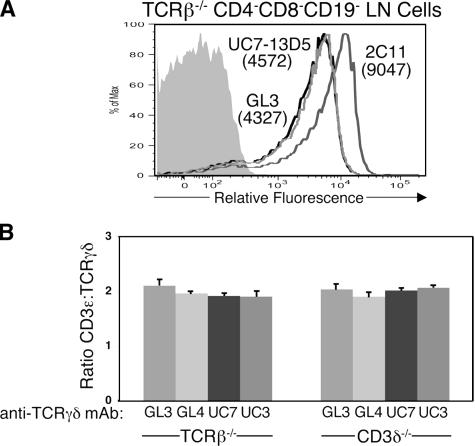
Figure 2.
Comparison of CD3 and TCRγδ surface levels on murine γδ T cells. (A) Histogram showing the relative fluorescence of 2C11, GL3, and UC7-13D5 (UC7) mAb staining on gated CD4−CD8−CD19− LN cells from TCRβ−/− mice. The 2C11 mAb (dark gray line) recognizes both CD3γɛ and CD3δɛ dimers, and the GL3 (bold line) and UC7 (light gray line) mAbs recognize TCRγδ heterodimers. Staining with a hamster isotype control is also shown (shaded histogram). The number in parentheses represents the mean fluorescence intensity for each mAb minus that of the hamster isotype control. (B) Ratio of CD3ɛ/TCRγδ (for calculation information see Materials and methods) for each anti-TCRγδ mAb on the surface of CD4−CD8−CD19− LN cells from TCRβ−/− mice (GL3, n = 10; GL4, n = 3; UC7, n = 10; UC3, n = 3) and CD4−CD8−TCRβ−CD19− LN cells from CD3δ−/− mice (GL3, n = 8; GL4, n = 4; UC7, n = 8; UC3, n = 3). Bars represent the means ± standard deviation.

