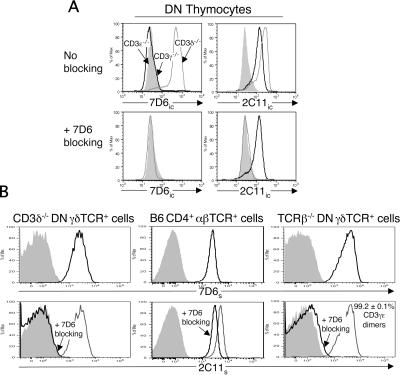
Figure 3.
Quantifying the relative percentage of CD3γɛ dimers on the surface of murine γδ T cells. (A) Intracellular staining (ic) of CD3 dimers in gated DN thymocytes from CD3γ−/− (bold line) and CD3δ−/− mice (gray line) using FITC-conjugated 2C11 (anti-CD3γɛ/δɛ) and Alexa 488–conjugated 7D6 (anti-CD3γɛ) mAbs. DN thymocytes are defined as CD4−CD8−CD19−TCRγδ−TCRβ−NK1.1−DX5−. Gated DN thymocytes from CD3ɛ −/− mice were used as a negative staining control (shaded histogram). Staining without (top) and with (bottom) 7D6 mAb blocking is shown. (B) Surface (s) staining of CD3 dimers on gated γδTCR+ CD4−CD8− LN cells from CD3δ−/− and TCRβ−/− mice and on gated αβTCR+ CD4+ LN cells from B6 mice using 2C11–FITC and 7D6–Alexa 488 mAbs. (top) Surface staining of 7D6–Alexa 488 mAb alone (bold line) and after blocking with purified 7D6 mAb (shaded histogram). (bottom) Surface staining of 2C11–FITC mAb alone (gray line), after blocking with purified 7D6 mAb (bold line), and after blocking with purified 2C11 mAb (shaded histogram). The mean relative percentage of CD3γɛ dimers on γδTCR+ CD4−CD8− LN cells from TCRβ−/− mice (n = 4; for calculation see Materials and methods) ± standard deviation is shown.

