Figure 4.
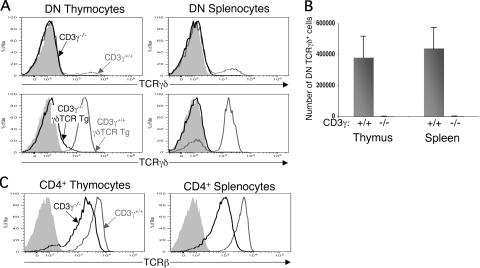
Phenotypic analysis of CD3γ−/− and γδTCR Tg CD3γ−/− mice. (A) Comparison of γδTCR surface levels on DN thymocytes and splenocytes from CD3γ−/− (bold line) and CD3γ+/+ (gray line) mice (top) and from γδTCR Tg CD3γ−/− (bold line) and γδTCR Tg CD3γ+/+ (gray line) mice (bottom). DN thymocytes and splenocytes are defined as CD4−CD8−CD19−. Staining with a hamster isotype control is also shown (shaded histogram). (B) Number of γδTCR+ CD4−CD8−CD19− cells in the thymus and spleen of CD3γ+/+ (n = 4) and CD3γ−/− (n = 6) mice. Bars represent means ± standard deviation. (C) Comparison of αβTCR surface levels on CD4+ thymocytes and splenocytes from CD3γ+/+ (gray line) and CD3γ−/− (bold line) mice. Staining with a hamster isotype control is also shown (shaded histogram).

