Figure 4.
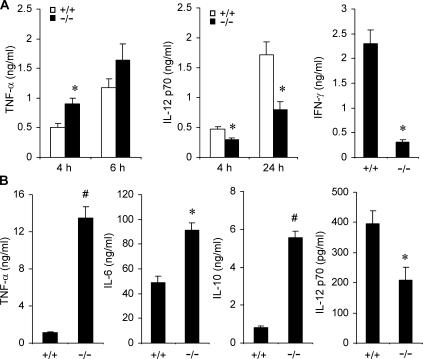
Knockout of Mkp-1 shifts the pattern of cytokine expression in splenocytes and dendritic cells. (A) Cytokine expression in LPS-stimulated splenocytes. Splenocytes isolated from Mkp-1 +/+ and Mkp-1 −/− mice were stimulated with 100 ng/ml LPS for the indicated times, and cytokine concentrations in the medium were assayed by ELISA. IFN-γ levels were measured 24 h after LPS treatment. Data are presented as the mean ± SEM (n = 3–9 for each group). *, Mkp-1 −/− different from Mkp-1 +/+, P < 0.05. (B) Cytokine production by bone marrow–derived dendritic cells from both Mkp-1 +/+ and Mkp-1 −/− mice. Cells were stimulated with 1 μg/ml LPS for 24 h. Data are presented as mean ± SEM (n = 3 in each group). *, Mkp-1 −/− different from Mkp-1 +/+ , P < 0.05; #, Mkp-1 −/− different from Mkp-1 +/+, P < 0.005.

