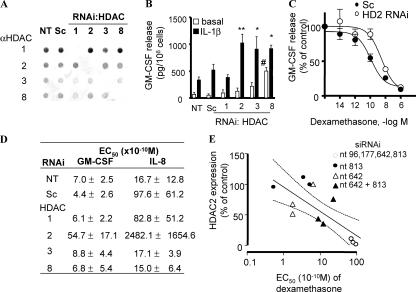
Figure 1.
HDAC2 KD-induced glucocorticoid insensitivity in A549 cells. (A) Dot blot analysis of nuclear extracts from A549 cells 48 h after transfection with siRNA against HDAC1, -2, -3, and -8; Sc; or vehicle only (NT). (B) IL-1β–stimulated (1 ng/ml for 24 h) GM-CSF production. Values represent means ± SEM. * and **, P < 0.05 and P < 0.01, respectively, versus IL-1β control; #, P < 0.05 versus basal control. n = 4∼8 experiments. (C) Concentration response curve of Dex suppression of IL-1β–induced GM-CSF production, and (D) summarized EC50 values of Dex (n = 4∼8). Values in C represent means ± SEM. (E) Correlation between EC50 and HDAC2 expression in HDAC2 RNAi cells. Different levels of HDAC2 expression were induced using individual siRNA or combinations of up to four duplexes against HDAC2. HDAC2 expression evaluated by Western blotting was shown as the percentage of that in nontreated cells. Dashed and continuous lines represent 95% confidence interval.

