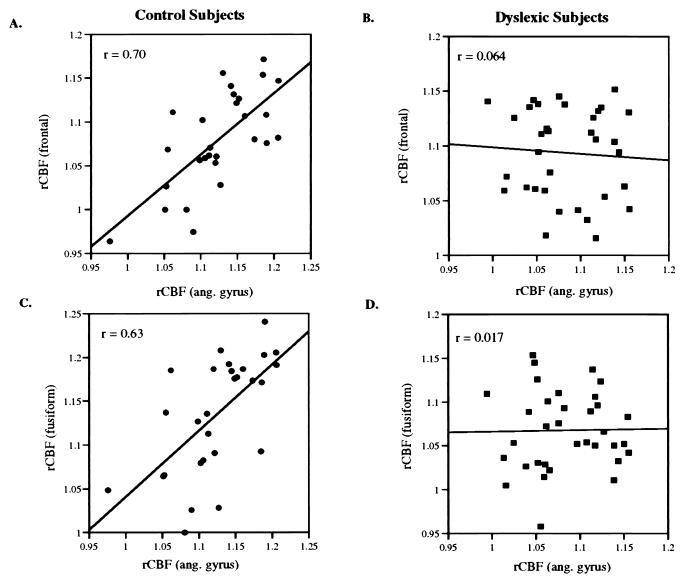
Figure 2.
Scatter plots showing rCBF in the left angular gyrus (Talairach coordinates −44, −54, 24) vs. rCBF in left inferior frontal cortex (A and B) and left fusiform gyrus (C and D) during pseudoword reading. A and C present data in normal subjects, B and D in the dyslexic patients. The Talairach location for frontal cortex is the local maximum shown in Table 1 (−36, 30, 16); for the fusiform location, it is also the Table 1 local maximum (−46, −34, −20). The values of each correlation coefficient is given in the upper left of each plot.

