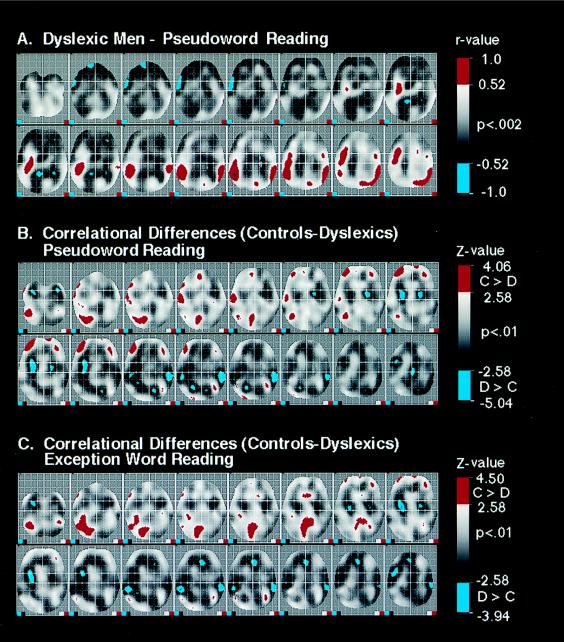
Figure 3.
(A) Correlation coefficients with a reference voxel in the left angular gyrus in dyslexic men during pseudoword reading; see the caption to Fig. 1 for details. (B and C) Z values corresponding to a voxel-by-voxel comparison of the correlation coefficients in controls and dyslexic men during pseudoword (B) and exception word (C) reading; each voxel’s Z value compares the correlation coefficient between standardized rCBF in that voxel with that in the left angular gyrus (−44, −54, 24). The gray scale indicates the value of Z (see color bar); red denotes regions where the correlations were significantly larger (P < 0.01) in controls than in the dyslexic men; cyan denotes regions where they were significantly smaller.

