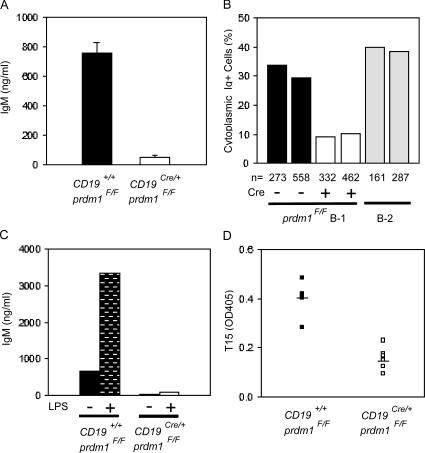
Figure 2.
Absence of Ig secretion in vitro and in vivo by CD19Cre/+prdm1flox/Flox B-1 cells. (A) Anti-IgM ELISA performed on supernatants from B-1 cells after enrichment and in vitro culture. B-1 cells were plated at a density of 106 cells/ml for 4 d with no stimulation. Graph represents five control and eight CD19Cre/+prdm1Flox/Flox samples. (B) Summary of data from two immunohistochemical experiments for the percentages of cytoplasmic Ig+ WT B-1 (filled bars, 33.8 and 29.5%), CD19Cre/+prdm1Flox/Flox B-1 (open bars, 9.2 and 10.2%), and 4-d LPS-treated splenic B-2 (gray bars, 39.1 and 37.9%) B cells. Percentages were determined by dividing the fraction of cytoplasmic Ig+ cells (WT, 68 Ig+/273 total and 114 Ig+/558 total; CKO, 23 Ig+/332 total and 32 Ig+/462 total) by the purity of the respective cultures (WT, 73.8 and 69.3% Mac1+IgM+; CKO, 74.9 and 67.5% Mac1+IgM+). The fraction of cytoplasmic Ig+ splenocytes (C; 63 Ig+/161 total and 109 Ig+/297 total) was determined directly because the culture was assumed to be near 100% pure. (C) Bar graph showing data from one representative anti-IgM ELISA experiment for untreated (no bars) or LPS-treated (bars) control (filled bars) and CD19Cre/+prdm1Flox/Flox (open bar)-purified B-1 cell cultures. ELISA was performed as in A. (D) Anti-T15 ELISA against serum harvested from 6–10-wk-old CKO (filled squares, n = 8) and control (open squares, n = 6) mice. Filled bars represent the SEM values. Units are OD405.

