Figure 3.
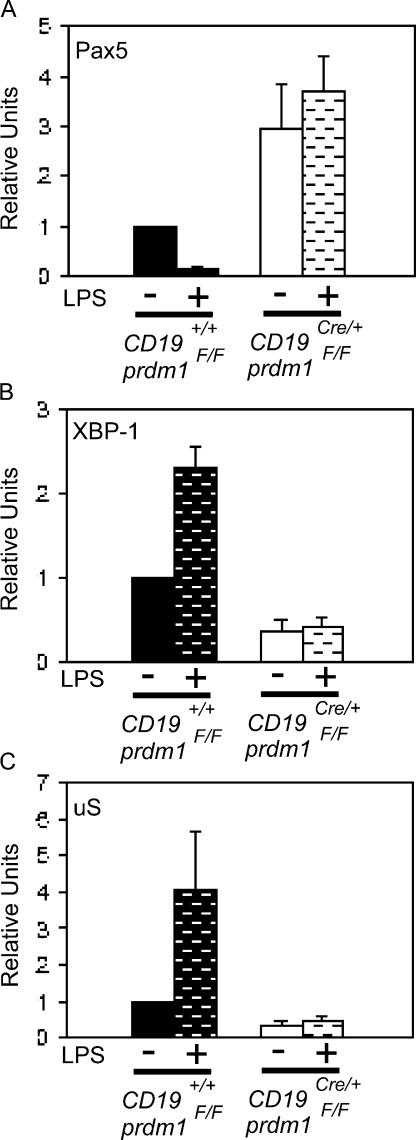
Misregulation of Blimp-1 targets in Blimp-1–deficient B-1 cells. Quantitative real-time PCR performed on cDNA prepared from purified, untreated (no bars) or LPS-treated (bars) control (filled bars) and CD19Cre/+prdm1Flox/Flox (open bars) B-1 cells. Mean and SEM for (A) Pax5 (n = 5; unstimulated CKO/WT, P = 0.050; LPS-stimulated CKO/WT, P = 0.002), (B) XBP-1 (n = 6; unstimulated WT/CKO, P < 0.001; LPS-stimulated WT/CKO, P < 0.001), and (C) μS (n = 6; unstimulated WT/CKO, P = 0.002; LPS-stimulated WT/CKO, P <0.040) steady-state mRNA levels are shown as relative units normalized to the untreated control samples. All values were normalized to β2 microglobulin mRNA.

