Figure 3.
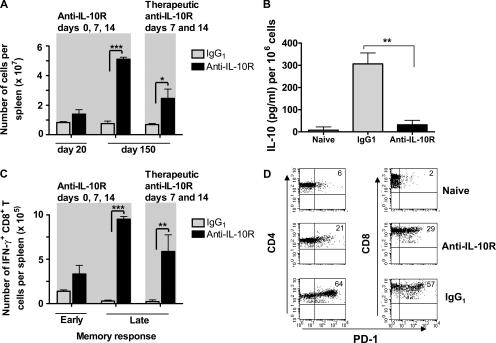
Anti–IL-10R antibody treatment in LCMV clone 13–infected mice increases total cell numbers, decreases IL-10 production, induces a functional antiviral memory T cell pool, and reduces the percentage of PD-1–expressing T cells. (A) 6-wk-old BALB/c mice were infected with 2 × 10⁶ PFU LCMV clone 13 and treated with an IgG1 isotype control antibody or i.p. with 250 μg of a neutralizing anti–IL-10R antibody on days 0, 7, and 14 (left) or with a therapeutic regimen on days 7 and 14 after LCMV clone 13 infection (right). On days 20 and 150 after LCMV infection, spleen cells were isolated and counted. Histogram bars represent mean values ± SD for three mice per group. The experiment is representative of three similar experiments. (B) Splenocytes from naive mice, LCMV clone 13–infected mice treated with IgG1, or anti–IL-10R antibody on days 0, 7, and 14 were isolated 3 wk after infection and cultured for 48 h. The amount of IL-10 present in the culture supernatant was measured by ELISA. Data are plotted as IL-10 (pg/ml) produced per 106 cells and are means of three mice per time point. Results are representative of three identical experiments. (C) Splenocytes from LCMV clone 13–infected BALB/c mice treated with IgG1 or anti–IL-10R antibody on days 0, 7, and 14 (left) or day 7 and 14 (right) were isolated at day 20 (early memory) and 150 (late memory) after infection. Cells were stimulated in the presence of NP118-126 peptide and BFA for 5 h. Intracellular cytokine staining was performed using fluorescent antibodies to CD8 and IFN-γ. The numbers of IFN-γ+CD8+ T cells per spleen are shown. Histogram bars represent mean values ± SD for three mice per group. The experiment is representative of three similar experiments. (D) BALB/c mice were treated with anti–IL-10R antibody or IgG1 isotype control antibody on days 7 and 14 after LCMV clone 13 infection. 90 d after infection, percentages of PD-1–expressing splenic CD4+ and CD8+ T cells were analyzed by gating on CD4+ (left) and CD8+ T cells (right) and staining for PD-1. Numbers in dot plots represent percentages of CD4+ and CD8+ T cells expressing PD-1. Data show one representative mouse per group (four mice total per group). Statistical analysis was performed using the Student's t test. *, P < 0.01; **, P < 0.001; and ***, P < 0.0001.

