Figure 1.
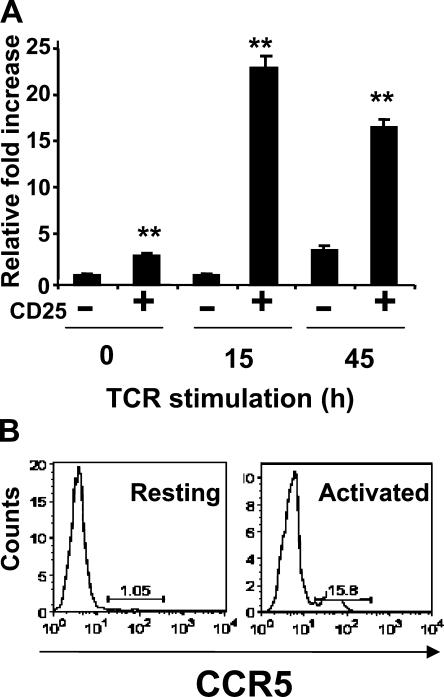
CD4+CD25+ regulatory T cells preferentially express CCR5. (A) CD4+CD25− (−) or CD4+CD25+ (+) T cells were isolated from the LNs of C57BL/6 mice by FACS and stimulated with 10 μg/ml of plate-bound anti-CD3 and 5 ng/ml IL-2. At various time points after stimulation, total RNA was isolated and real-time PCR analysis of CCR5 expression relative to 18S rRNA expression was performed. Similar results were obtained in three additional experiments performed. Results represent the mean ± SD. **, P < 0.001, difference from WT mice. (B) CCR5 expression on resting (left) and anti-CD3–activated (right) CD4+Foxp3+ T cells. Cells were stained for intranuclear Foxp3 and surface CD4 and CCR5, and analyzed by FACS. Similar results were obtained in three separate experiments performed.

