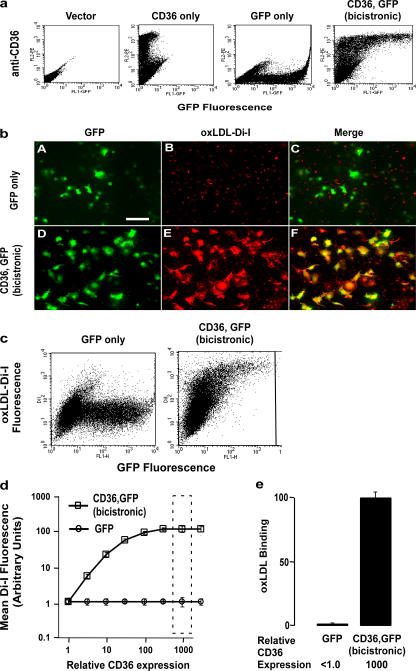
Figure 2.
Development of two-color flow cytometry–based binding assay permitting concomitant quantification of CD36 surface expression level and ligand binding. (a) K562 (chronic myelogenous leukemia) cells were transfected with plasmids encoding empty vector (control), only human CD36, only GFP, or both CD36 and GFP using the bicistronic (IRES) vector as described in Materials and methods. Cells were cultured overnight, and cell surface CD36 (CD36-mAb conjugated to phycoerythrin) and GFP fluorescence were simultaneously analyzed by two-color flow cytometry. Note that the bicistronic plasmid expresses cell surface CD36 receptor in a dose-dependent manner as a function of GFP fluorescence. (b) Cos-7 cells were transfected with DNA plasmids encoding either GFP only or both CD36 and GFP proteins using the bicistronic vector. Cells were then incubated at 4°C in the absence versus presence of oxLDL labeled with the lipophilic dye Di-I), washed, and visualized, as described in Materials and methods. Note that a high degree of Di-I fluorescence (oxLDL binding) is only observed in cells transfected with CD36 and that the cells demonstrating Di-I fluorescence (oxLDL binding) have cellular staining patterns similar to those observed for GFP within the CD36 + GFP bicistronic transfected cells (images D, E, and F). For comparison, only background Di-I fluorescence is seen in cells transfected with GFP only (images A, B, and C). Bar, 50 μm (c) K562 cells transfected with plasmids expressing CD36,GFP (bicistronic) or GFP alone were cultured overnight and incubated with 40 μg/ml oxidized (via the MPO-NO2 −–H2O2 system) LDL labeled with the lipophilic dye Di-I at 4°C for 30–60 min. After extensive washing to remove unbound oxLDL, CD36 expression (a function of GFP fluorescence) and oxLDL binding (red fluorescence) were analyzed simultaneously by two-color flow cytometry. A representative flow cytometry dot plot is shown. Note that oxLDL binds to CD36-expressing cells in a dose-dependent fashion (i.e., with increasing CD36 expression there is a corresponding increase in oxLDL binding). (d) The mean oxLDL-Di-I fluorescence is plotted against the relative CD36 expression levels as monitored by the mean GFP fluorescence intensity from triplicate binding experiments shown in panel a. (e) LDL binding is shown for the single CD36 expression level (as measured by the GFP fluorescence intensity interval), indicated by the dashed-line rectangle in d. Results represent the mean ± SD for three independent experiments.

