Figure 3.
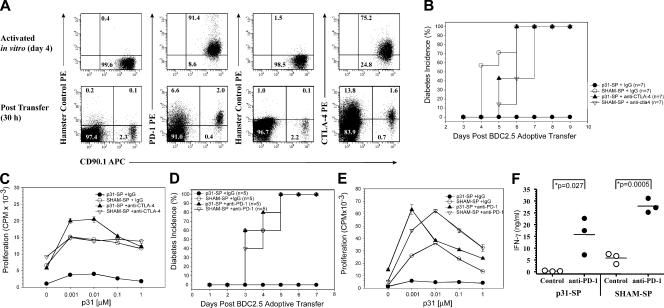
CTLA-4 and PD-1 blockade prevents the induction of antigen-SP tolerance and restores autoreactive T cell function. (A) Up-regulation of PD-1 and CTLA-4 expression on diabetogenic BDC2.5 T cells after p31 antigen activation in vitro (day 4; top) and 30 h after p31-SP transfer (bottom). Flow cytometric analysis was performed on congenic BDC2.5 CD90.1+ CD4+ T cells for PD-1 and CTLA-4 expression. CD4+ gated events are shown illustrating increased PD-1 and CTLA-4 expression on the majority of the CD90.1 cells compared with isotype hamster control staining. Numbers illustrate the percentage of cells in each quadrant. (B–E) Anti–CTLA-4, anti–PD-1, or IgG control was administered surrounding BDC transfer and coupled cell tolerance to determine the role of these inhibitory molecules during tolerance induction. (B) Diabetes incidence and (C) day 3 p31-specific proliferation is shown for p31-SP plus IgG-tolerized mice (•; n = 7), SHAM-SP plus IgG control mice (◯; n = 7), anti–CTLA-4 p31-SP mice (▴; n = 7), and anti–CTLA-4 SHAM-SP control mice (▿; n = 7). (D) Diabetes incidence and (E) day 3 p31-specific proliferation is shown for p31-SP plus IgG-tolerized mice (•; n = 5), SHAM-SP plus IgG control mice (◯; n = 5), anti–PD-1 p31-SP mice (▴; n = 5), and anti–PD-1 SHAM-SP control mice (▿; n = 5) illustrating PD-1 reversal of antigen- SP tolerance. (F) p31-specific IFN-γ production from p31-SP and SHAM-SP mice treated with IgG or anti–PD-1 (n = 3) demonstrating significant IFN-γ increase after anti–PD-1 treatment (P = 0.027). Results shown are representative from two independent experiments.

