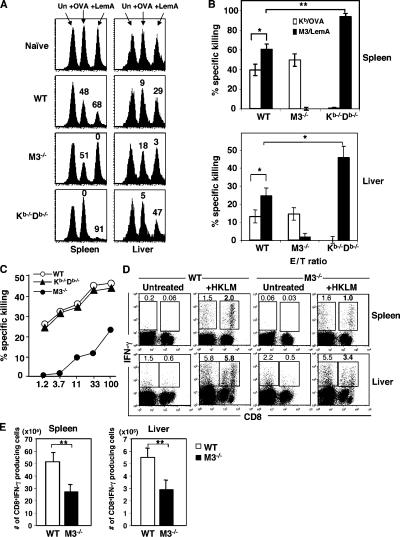
Figure 4.
Impaired LM-specific cytolytic activity and the IFN-γ production in M3−/− mice. (A) LM infection elicited a potent H2-M3–restricted CTL response during the early phase of infection. M3−/−, Kb−/−Db−/−, and WT mice were infected with rLM-ova. Fluorescence-labeled peptide-pulsed or unpulsed B6 splenocytes were coinjected i.v. into day 3 LM-infected or naive mice. In vivo cytolysis was assessed 15 h later by flow cytometry. Histograms are gated on PKH26+ target cells and the numbers above each peak represent the percent of specific killing. The data are representative of eight mice per group from two independent experiments. (B) The bar graph indicates the percentage of specific lysis for OVA- and LemA-coated targets from the indicated group of mice. Data shown are the mean ± SEM of eight animals per group. (C) Diminished LM-specific cytolytic activity in M3−/− mice. 5 d after LM infection, splenocytes from indicated mice were activated with Con A and examined for CTL activity to 51Cr-labeld LM-infected J774-Kb target cells. Each data line represents the mean from two mice. Data are representative of results obtain from three independent experiments. Specific lysis for uninfected J774-Kb targets was below 5% from all effectors tested. (D and E) Decreased LM-specific, IFN-γ–producing CD8+ T cells in M3−/− mice. Splenocytes and hepatic leukocytes from indicated mice were harvested on day 7 after LM infection and stimulated overnight with HKLM. Cells were stained for CD8 expression and intracellular IFN-γ, and analyzed by flow cytometry. The percentages of CD8+IFN-γ+ and CD8−IFN-γ+ cells are indicated (D). Results are representative from eight mice per group. Bar graph depicts mean ± SEM for total number of LM-specific CD8+ cells in the spleens and livers of M3−/− and WT mice (E). M3−/− and WT controls used in these experiments are from N10 backcross.

