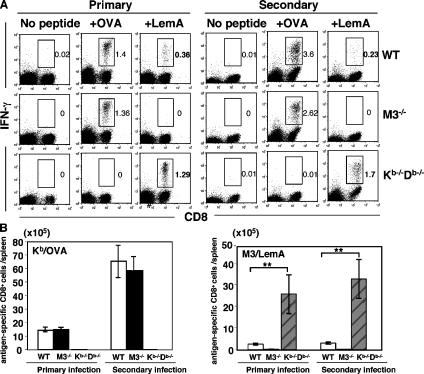
Figure 7.
Comparison of MHC class Ia– and H2-M3–restricted CD8+ T cell responses in LM-infected M3−/−, Kb−/−Db−/−, and WT mice. M3−/− (N10), Kb−/−Db−/−, and WT mice were infected i.v. with 5 × 10⁴ CFU of rLM-ova. Some of the mice were rechallenged 1 mo later with 106 CFU of the same bacteria. (A) The frequencies of Kb/OVA-specific and H2-M3/LemA-specific CD8+ T cells were determined by intracellular IFN-γ staining at day 7 after primary infection or day 3 after secondary infection. In brief, splenocytes isolated from LM-infected mice were stimulatedin vitro with either LemA or OVA peptide. 5 h later, intracellular cytokine staining for IFN-γ were performed. Antigen-specific CD8+IFN-γ+ T cells are highlighted by the gate, and the percentage of gated cells is indicated. Data are representative of results obtained from five to eight mice per group. (B) Bar graphs depict mean ± SEM for the total number of Kb/OVA-specific or H2-M3/LemA-specific CD8+ T cells in the spleens of WT, M3−/−, and Kb−/−Db−/− mice.

