Figure 3.
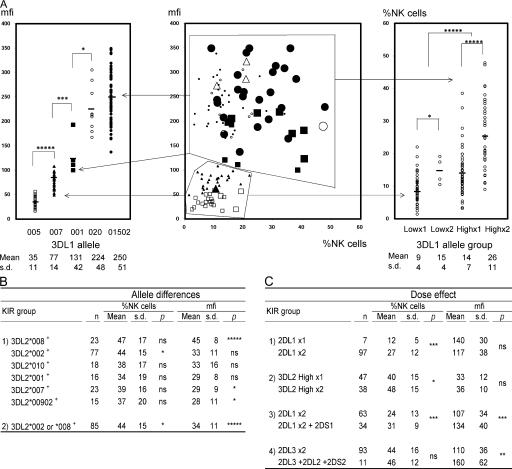
Allelic polymorphisms of KIR3DL genes determine different levels of cell surface expression. (A) The central panel shows flow cytometric analysis of NK cells stained with the DX9 antibody. The x and y axes are the same as in Fig. 2. Each large data point represents a single person; however, the high and low peaks in donors with bimodal DX9 binding patterns are each represented independently with small data points. 3DL1/3DS1 heterozygotes are represented as one small data point. The 3DL1 genotypes are represented by different symbols; ▪: 3DL1*001 × 1,  : *001+*01502, Δ: *01502+*020, □: *005 × 1,
  : *005 × 2, ▴: *007 × 1,
  : *007 × 2, •: *01502 × 1,
  : *01502 × 2, ◯: *020 × 1,
  : *020 × 2. The staining as a result of the “low-binding allotypes” (3DL1*005 and *007) is distinguished from that of the “high-binding allotypes” (3DL1*001, *01502, and *020) by the gates. The left panel is a one-dimensional plot of mfi showing how each of the five 3DL1 allotypes corresponds to a different range and mean value of DX9 binding. The right panel is a one-dimensional plot of percentage of NK cells binding DX9 in which the panel members were divided into four groups according to 3DL1 genotype: one low-binding allotype, two low-binding allotypes, one high-binding allotype, and two high-binding allotypes. The frequency of NK cells expressing 3DL1 increases with gene dose. (B) Correlations between flow cytometric analysis (%NK cells and mfi) with DX31 and the different 3DL2 allotypes. Pairwise comparisons were made between phenotypes with and without each 3DL2 allotype in “1),” or with and without the allotype group comprising 3DL2*002 and *008 in “2).” (C) The effects of gene dose on %NK cells and mfi observed with EB6, DX31, and DX27. Pairwise comparisons were made in phenotypes between the two donor groups that differed in gene content as indicated from “1)” to “4).” One copy of a gene is shown by x1, two copies are shown by x2. *, P < 0.05; **, P < 0.01; ***, P < 0.005; and *****, P < 0.0005.

