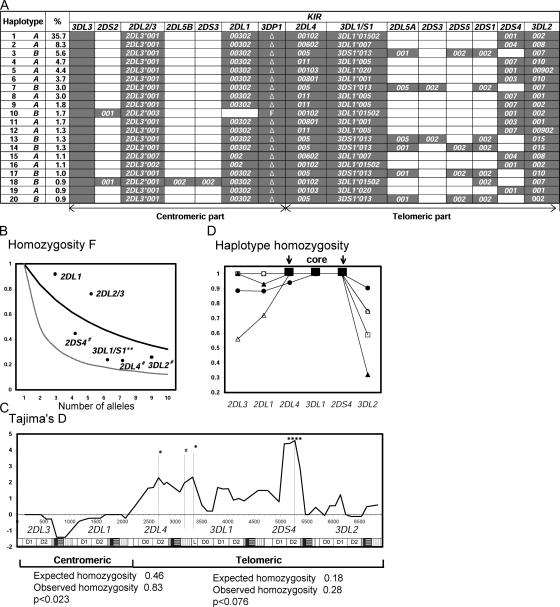
Figure 6.
KIR haplotypes have been subject to balancing selection and positive directional selection. (A) Deduced allele-level KIR haplotypes. Shown are the 20 most common haplotypes, their frequencies, and their assignment to group A or B. These haplotypes were all identified by independent analytical methods: the EM-algorithm and the Bayesian phasing method. Independent analysis of three families confirmed the segregation of haplotypes 1, 2, 3, 5, 7, 13, and 15 (not depicted). (B) The Ewens-Watterson homozygosity statistic (F) was used to assess the departure from neutrality of the KIR allele frequencies in 116 Japanese donors. The thick line shows the neutral expectation. F values that are higher than the neutral expectation indicate purifying or directional selection; those that are lower than neutral expectation indicate balancing selection. The thin line shows the limit at maximum balancing selection. The 2DS4, 3DL1, 2DL4, and 3DL2 genes from the telomeric part of the KIR locus appear subject to balancing selection (**, P < 0.01 and #, P < 0.1). 2DL1 and 2DL3 genes in the centromeric part of the KIR locus show a trend toward purifying or directional selection. (C) Tajima's D statistic was applied to a composite of 182 group A coding-region haplotypes using a sliding window. The positions of the individual KIR in the composite are shown along the bottom of the panel. Positive values are indicative of balancing selection, negative values of purifying or directional selection. *, P < 0.05; ****, P < 0.001; and #, P < 0.1. Beneath the panel the results are shown for the Ewens-Watterson test on the centromeric and telomeric parts of the 182 group A haplotypes. Significance was assessed by Watterson's exact test. For both parts, the observed homozygosity was higher than expected. (D) The 182 group A haplotypes are all variants of five basic forms, which can be defined by the five KIR3DL1 alleles. For each of these five subgroups, the haplotype homozygosity is shown. The subgroups are as follows: •: 3DL1*01502, ▴: 3DL1*005, Δ: 3DL1*007, □: 3DL1*001, ◯: 3DL1*020. For each haplotype subgroup, there is a central region of high LD encompassing the 2DL4, 3DL1, and 2DS4 genes, which is flanked by regionsof reduced LD.

