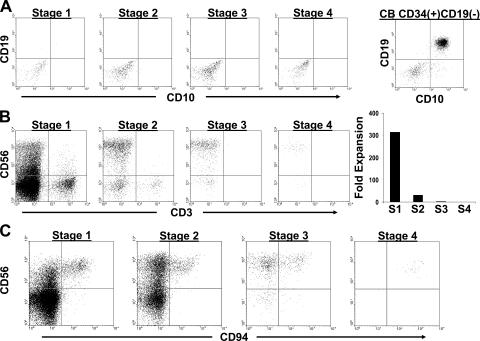
Figure 6.
B and T cell differentiation potential of stages 1–4. (A) Representative analysis from one of two experiments culturing SLT-derived stages 1–4 or CB-derived CD34(+)CD19(−) cells on MS-5 stroma in FL, KL, and G-CSF for 6 wk. Dot plots were gated on live cells using a lymphocyte gate by FSC versus SSC. (B) Representative analysis from one of three experiments in which stages 1–4 were co-cultured for 4–5 wk on the OP9-DL1 cell line in FL and IL-7. The OP9-DL1 line expresses GFP. The four dot plots shown were gated on GFP(−) events within the live fraction by FSC versus SSC analysis. The graph on the right shows the fold increase in total GFP(−) cell number starting with 103 cells from each stage (S1–S4). n = 1 (representative graph from one of three experiments). (C) Generation of CD3(−)CD56brightCD94(+) stage 4 cells on OP9-DL1 stroma. Stage 1–4 cells were cultured as in B. The dot plots shown were gated on GFP(−)CD3(−) live cell events and are representative of three separate experiments.

