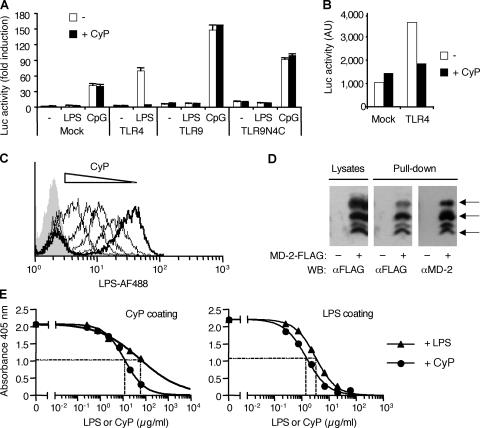
Figure 3.
CyP inhibits LPS at the level of MD-2–TLR4 extracellular domain. (A) Luciferase activity of Jurkat cells transfected with a 3×NF-κB–driven luciferase reporter together with empty vector (Mock) or expression vectors encoding either TLR4, TLR9, or a chimera of extracellular TLR9 and intracellular TLR4 (TLR9N4C) and stimulated with 1 μg/ml LPS or 3 μM CpG. Reporter activity was measured after 16 h of LPS stimulation in the absence (white bars) or presence (black bars) of 20 μg/ml CyP. Similar results were obtained at 6 h of stimulation. Data represent the mean ± SD of duplicates of one experiment of two performed with identical results. (B) Spontaneous luciferase activity in Jurkat cells transfected with a 3×NF-κB–driven luciferase reporter together with an empty vector (Mock) or an expression vector encoding TLR4. Reporter activity in the absence (white bars) or presence (black bars) of CyP was measured 40 h after transfection in a 6-h assay. (C) Monocytes were stained with LPS conjugated to Alexa Fluor 488 (0.25 μg/ml LPS-AF488) in the absence (thick line) or presence (thin lines) of increasing concentrations of CyP (0.25, 12.5, 125, and 250 μg/ml) and analyzed by FACS. Background fluorescence of monocytes is shown as a gray profile. One representative experiment of four is shown. Fig. S3 shows the EC50 of CyP inhibiting LPS binding. (D) HEK293T cells mock transfected or transfected with MD-2–FLAG were either lysed and probed for MD-2 expression with anti-FLAG antibodies or treated with 20 μg/ml biotinylated CyP. Biotinylated CyP was then captured with immobilized streptavidin, and MD-2 coprecipitates were detected with anti-FLAG antibodies. Stripped blots were subsequently probed with anti–MD-2 antibodies. Arrows indicate specific bands of differentially glycosylated MD-2 (reference 63). (E) Recombinant human MD-2 (1 μg/ml, fixed concentration) was incubated in wells coated with CyP (left) or LPS (right) in the presence of increasing concentrations of soluble LPS or CyP (0.24, 0.74, 2.22, 6.66, 20, and 60 μg/ml). MD-2 bound to the coated plate was then detected by a specific anti–MD-2 antibody followed by horseradish peroxidase–conjugated secondary antibody. EC50 values were calculated on sigmoidal dose–response curves (variable slope; R squared, 0.9953 or 0.9939 and 0.9692 or 0.9996 for CyP and LPS on CyP or LPS coat, respectively). Data shown are from one experiment of two performed with identical results.

