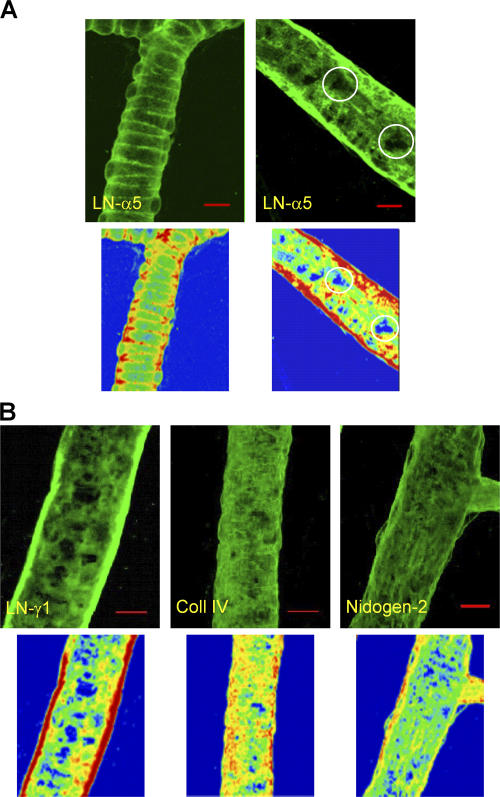
Figure 1.
Expression profiles of basement membrane proteins in unstimulated cremasteric vessel walls: identification of LE regions. The figure shows representative three-dimensional images of “semi-vessels” of unstimulated cremasteric microvessels immunostained for different matrix proteins. (A) Expression of LN-α5 chain (detecting laminin 10) in an arteriole (left) and venule (right), with corresponding intensity profiles (below the images). The color coding shows low intensity sites as blue and high intensity sites as red. Representative laminin 10 LE regions in the imaged venular wall are indicated by white circles. (B) Expressions of laminin γ1 (constituent of both laminins 8 and 10), collagen IV, and nidogen-2 and their corresponding intensity profiles. Each image is representative of at least five vessels/tissue (at least n = 4 mice per group). Bar, 10 μm.

