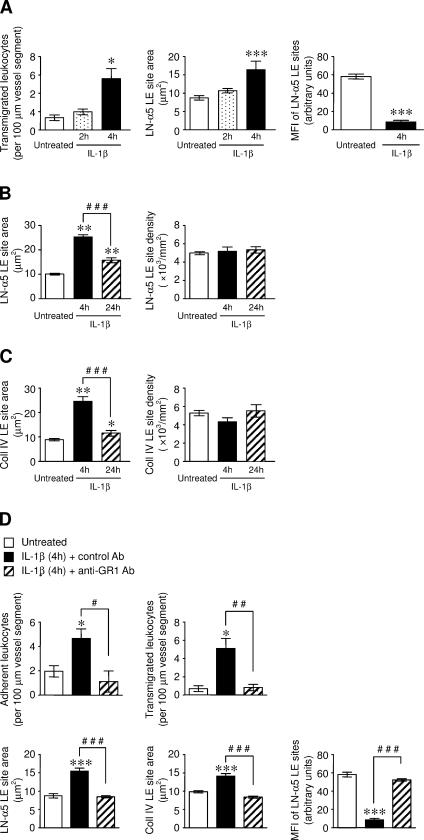
Figure 6.
Average size and intensity, but not number/unit area, of LE sites in both laminin 10 and collagen IV networks is increased in IL-1β–stimulated tissues in a neutrophil-dependent manner. Leukocyte responses of firm adhesion and/or transmigration were quantified in untreated or IL-1β (50 ng/mouse)–stimulated mouse cremaster muscles by intravital microscopy at indicated time points after i.s. injection of IL-1β. In some experiments, after in vivo analysis of responses, tissues were dissected from the mice and immunostained for laminin 10 (LN-α5 chain) or collagen IV. Three-dimensional images of venules were scanned and density (number/unit area), area, and average fluorescence intensity of matrix protein LE sites were measured as described in Materials and methods. (A) The two graphs on the left show time course of neutrophil transmigration and area of LE sites within the LN-α5 network in untreated tissues and in tissues stimulated for the indicated periods with IL-1β. The graph on the right shows mean of fluorescence intensity (MFI, arbitrary units) of LE regions. (B) The graphs show the area (left) and density (right) of LE sites within the LN-α5 network in untreated tissues and in tissues stimulated for the indicated periods with IL-1β. (C) Similarly, the graphs show the area (left) and density (right) of collagen IV LE sites in untreated and IL-1β–stimulated tissues. (D) Mice were depleted of their circulating neutrophils by injection of anti-GR1 mAb and control mice were injected with an isotype-matched control mAb (100 mg i.p. for both mAbs). 24 h later, mice were injected i.s. with IL-1β (50 ng/mouse) and 4 h later leukocyte adhesion and transmigration was quantified by intravital microscopy. At the end of the in vivo test period, cremaster muscle tissues were dissected away, fixed, and immunostained for laminin 10 (LN-α5) or collagen IV and the size and/or intensity (MFI) of LE regions were quantified as detailed in Materials and methods. In all panels, a total of 316–716 LE sites from three to seven vessel segments/tissue (n = 3–4 mice per group) were analyzed. Significant differences in responses in IL-1β–stimulated tissues as compared with unstimulated tissues are indicated by asterisks, *, P < 0.05 and ***, P < 0.001. Further comparisons are shown by lines. #, P < 0.05; ##, P < 0.01; and ###, P < 0.001.

