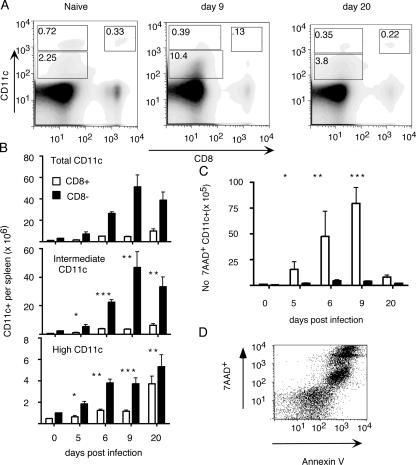
Figure 4.
Increase in the numbers of CD11c+CD8− DCs in spleens during infection with P. chabaudi. BALB/c mice were infected with 105 P. chabaudi, killed on different days after infection, and stained with anti-CD11c and CD8 Abs. (A) Representative FACS plot of DCs from naive mice at day 9 and 20 after infection. Numbers in boxes refer to the percentages of cells in each gate. (B) CD11c+CD8+ DCs (white bars) and CD11c+CD8− DCs (black bars) in spleens of naive mice and mice on days 5, 6, 9, and 20 after infection; total number of CD11c+ cells (top), cells with intermediate levels of CD11c+ (middle), and cells with high surface expression of CD11c (bottom). Isotype controls on both cell populations showed no staining at any time during infection. The numbers represent the means and SEM (>10%; error bars) of three mice. (C) Splenic CD11c+CD8+ DCs are more apoptotic than CD8− DCs in spleens of mice infected with P. chabaudi. The number of 7AAD-positive CD11chigh CD8+ (white bars) and CD11chigh CD8− DCs (black bars) in spleens of naive mice and mice infected for days 5, 6, 9, and 20. The data are means and SEM (>10%) of three mice and are representative of three experiments. Asterisks denote that the differences are significant. (D) Representative FACS plot of CD11c+CD8+ DCs stained with 7AAD and Annexin V from mice 9 d after infection.

