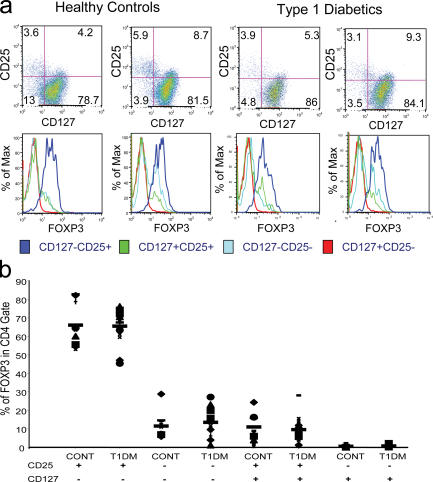
Figure 8.
Frequency of various T cell subsets in patients with T1D versus healthy control subjects. (a) FACS data are depicted from two healthy control and two individuals with T1D. Individual histograms are depicted to show the FoxP3 expression in CD4+ T cells subdivided into the various CD25 and CD127 subsets. (b) Individual FoxP3 expression data is depicted from total 10 healthy control individuals and 16 patients with T1D. Each symbol represents an individual subject and the narrow bar represents the mean percentage of FoxP3+ T cells in various T cell subsets (CD4+ T cells gated based on CD25 and/or CD127 expression as indicated at the bottom of the graph).

