Figure 2.
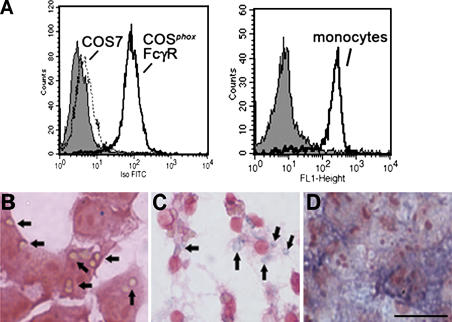
Expression of FcγIIA receptor, phagocytosis, and NADPH oxidase activity. (A) Analysis of FcγIIA expression by flow cytometry using an FITC-conjugated antibody against CD32 is shown for COS7 and COSphoxFcγR cells (left) and human peripheral blood monocytes (right) as indicated. The gray histogram indicates staining of either COSphoxFcγR or monocytes with an FITC-conjugated isotype control mAb. (B and C) Phagocytosis of IgG–sheep RBCs in media containing NBT. (B) COSphoxFcγR cells incubated with IgG-RBCs for 30 min at 37°C. Many of the ingested IgG-RBCs, which appear tan, are indicated by arrows. (C) Murine bone marrow–derived macrophages incubated with IgG-RBCs for 10 min at 37°C. Formazan-stained phagosomes, indicative of intraphagosomal superoxide production, are indicated by arrows. (D) COSphoxFcγR cells incubated with 100 ng/ml phorbol myristate acetate for 30 min, showing diffuse formazan deposits. Bar, 30 μm.

